Aljo Castro

Data Analyst Portfolio
Data Analyst
Technical Skills: Python, R, SQL, JSON, Tableau, PowerBI, MS Azure.
Education
Master of Science, Data Analytics (2026)
Bachelor of Science, Finance (2018)
Minor in Business & Economics
Work Experience
Quality Assurance Analyst @ Sonic Manufacturing Technologies (March 2025 - Present)
- Monitor and analyze quality performance metrics.
- Produce actionable reports to inform data-driven decision-making and process improvement.
- Develop and execute automated data-collection workflows to reduced defect resolution turnaround by 20%.
- Partnered with engineering and production teams to elevate product quality and streamline processes.
Data Analyst Consultant @ Non-Profit Organization (Jan 2024 - Dec 2024)
- Collect, process, analyze, and interpret datasets to identify trends, insights, and relationships between data.
- Develop data models, statistical summaries, dashboards, and reports to provide recommendations.
- Collaborate with cross-functional teams to conduct data quality checks and ETL processes.
Financial Data Analyst @ Federal Government (Jan 2018 - Dec 2023)
- Processed, analyzed, and interpreted complex datasets to identify trends and present insights to stakeholders.
- Data modeling and statistical analysis, to identify, evaluate, and predict risk exposure.
- SQL queries and script processes, improving code scalability and data accessibility.
- Integration of BI analytical software and implementation of data cube structures, OLAP, for better analysis reports.
Financial Analyst @ Rentek Operational Solutions (Sep 2015 - Dec 2017)
- Analyzed financial statements, credit reports, and outlined industry trends for stakeholders.
- Create reports to conduct trend analysis and enhance financial reporting capabilities.
- Automated several report processes that improved quality and accessibility of data, and reduced report generation time.
Projects
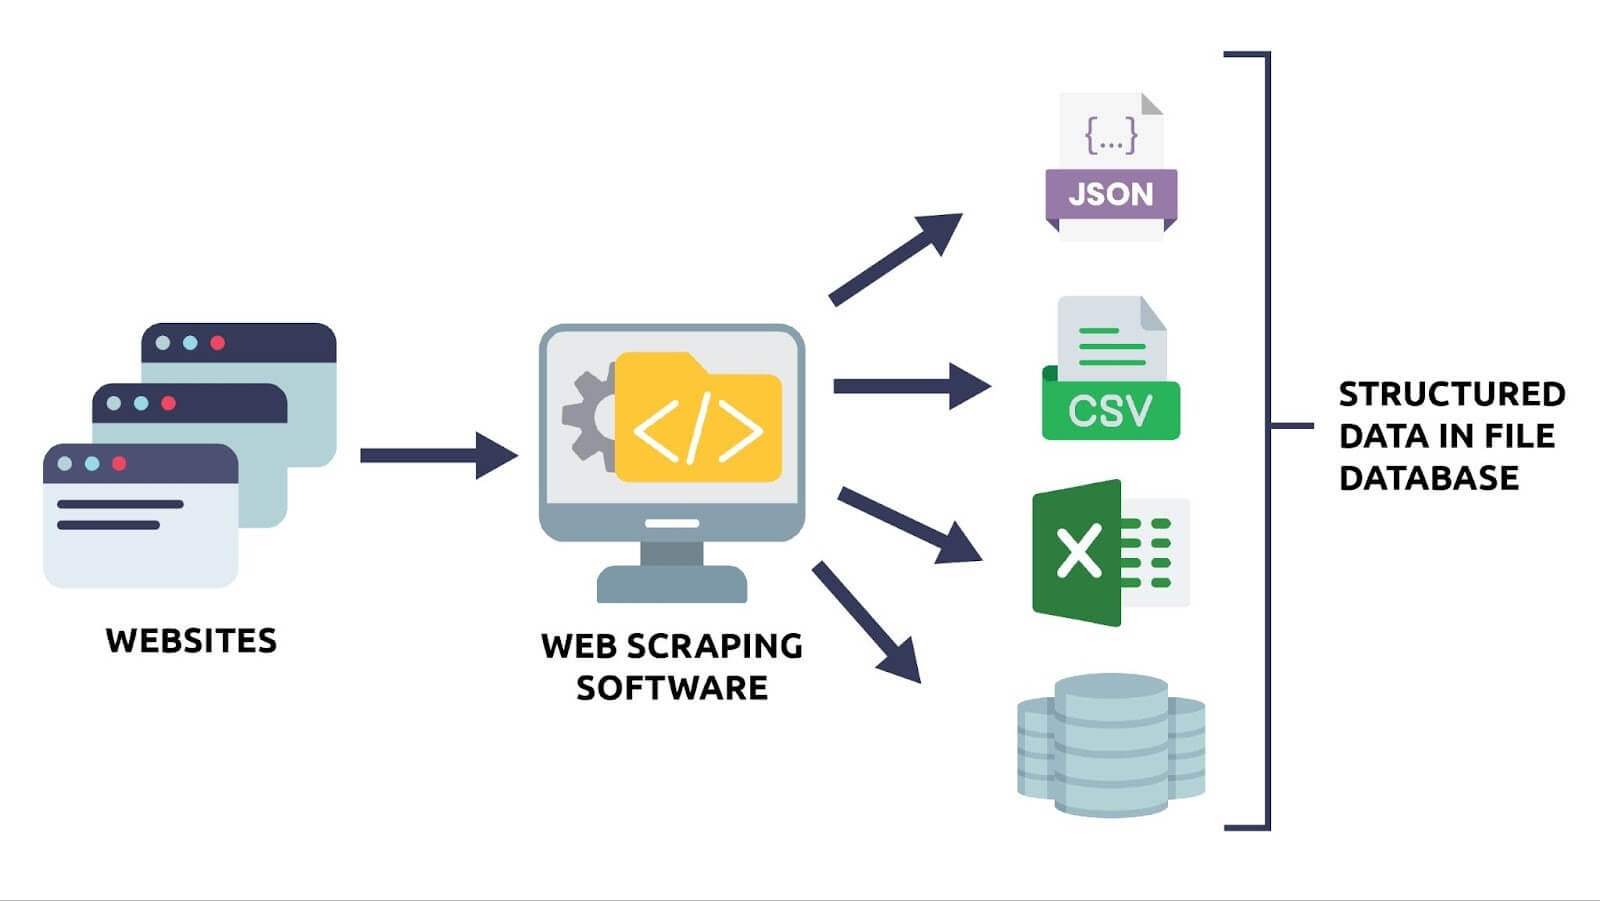
Amazon Web Scraper Using Python
This Amazon Price Tracker is a Python automation tool that monitors Amazon product prices and sends an email alert when the price drops below a defined threshold. It uses BeautifulSoup and Requests to scrape live product data, logs each check with a timestamp for historical tracking, and leverages smtplib to deliver instant notifications.
Key Highlights:
🔍 Web Scraping – Extracts product title, price, and other key details directly from Amazon product pages.
⏱ Scheduled Checks – Can run at set intervals to keep price data up to date.
📊 Data Logging – Saves timestamps and price history, can be used for trend analysis.
📧 Email Alerts – Notifies you instantly when the price drops below your desired limit.
🛠 Tech Stack – Python, BeautifulSoup, Requests, smtplib.
Crypto Real Time Analytics
This project is a near real-time cryptocurrency analytics pipeline built with Python. It continuously fetches cryptocurrency prices from the CoinGecko API every minute, enhances the raw data with rolling averages, volatility, and percent change, and load the results that power an interactive Tableau dashboard to be used real-time analysis.
Key Highlights:
📡 API Integration – Pulls live market data directly from CoinGecko
⏱ Real-Time Updates – Fetches new records every minute
📊 Advanced Metrics – Rolling averages, volatility, and % changes
🎨 Interactive Dashboards – Built with Tableau Public
🧩 ETL Workflow – Extract → Transform → Load data

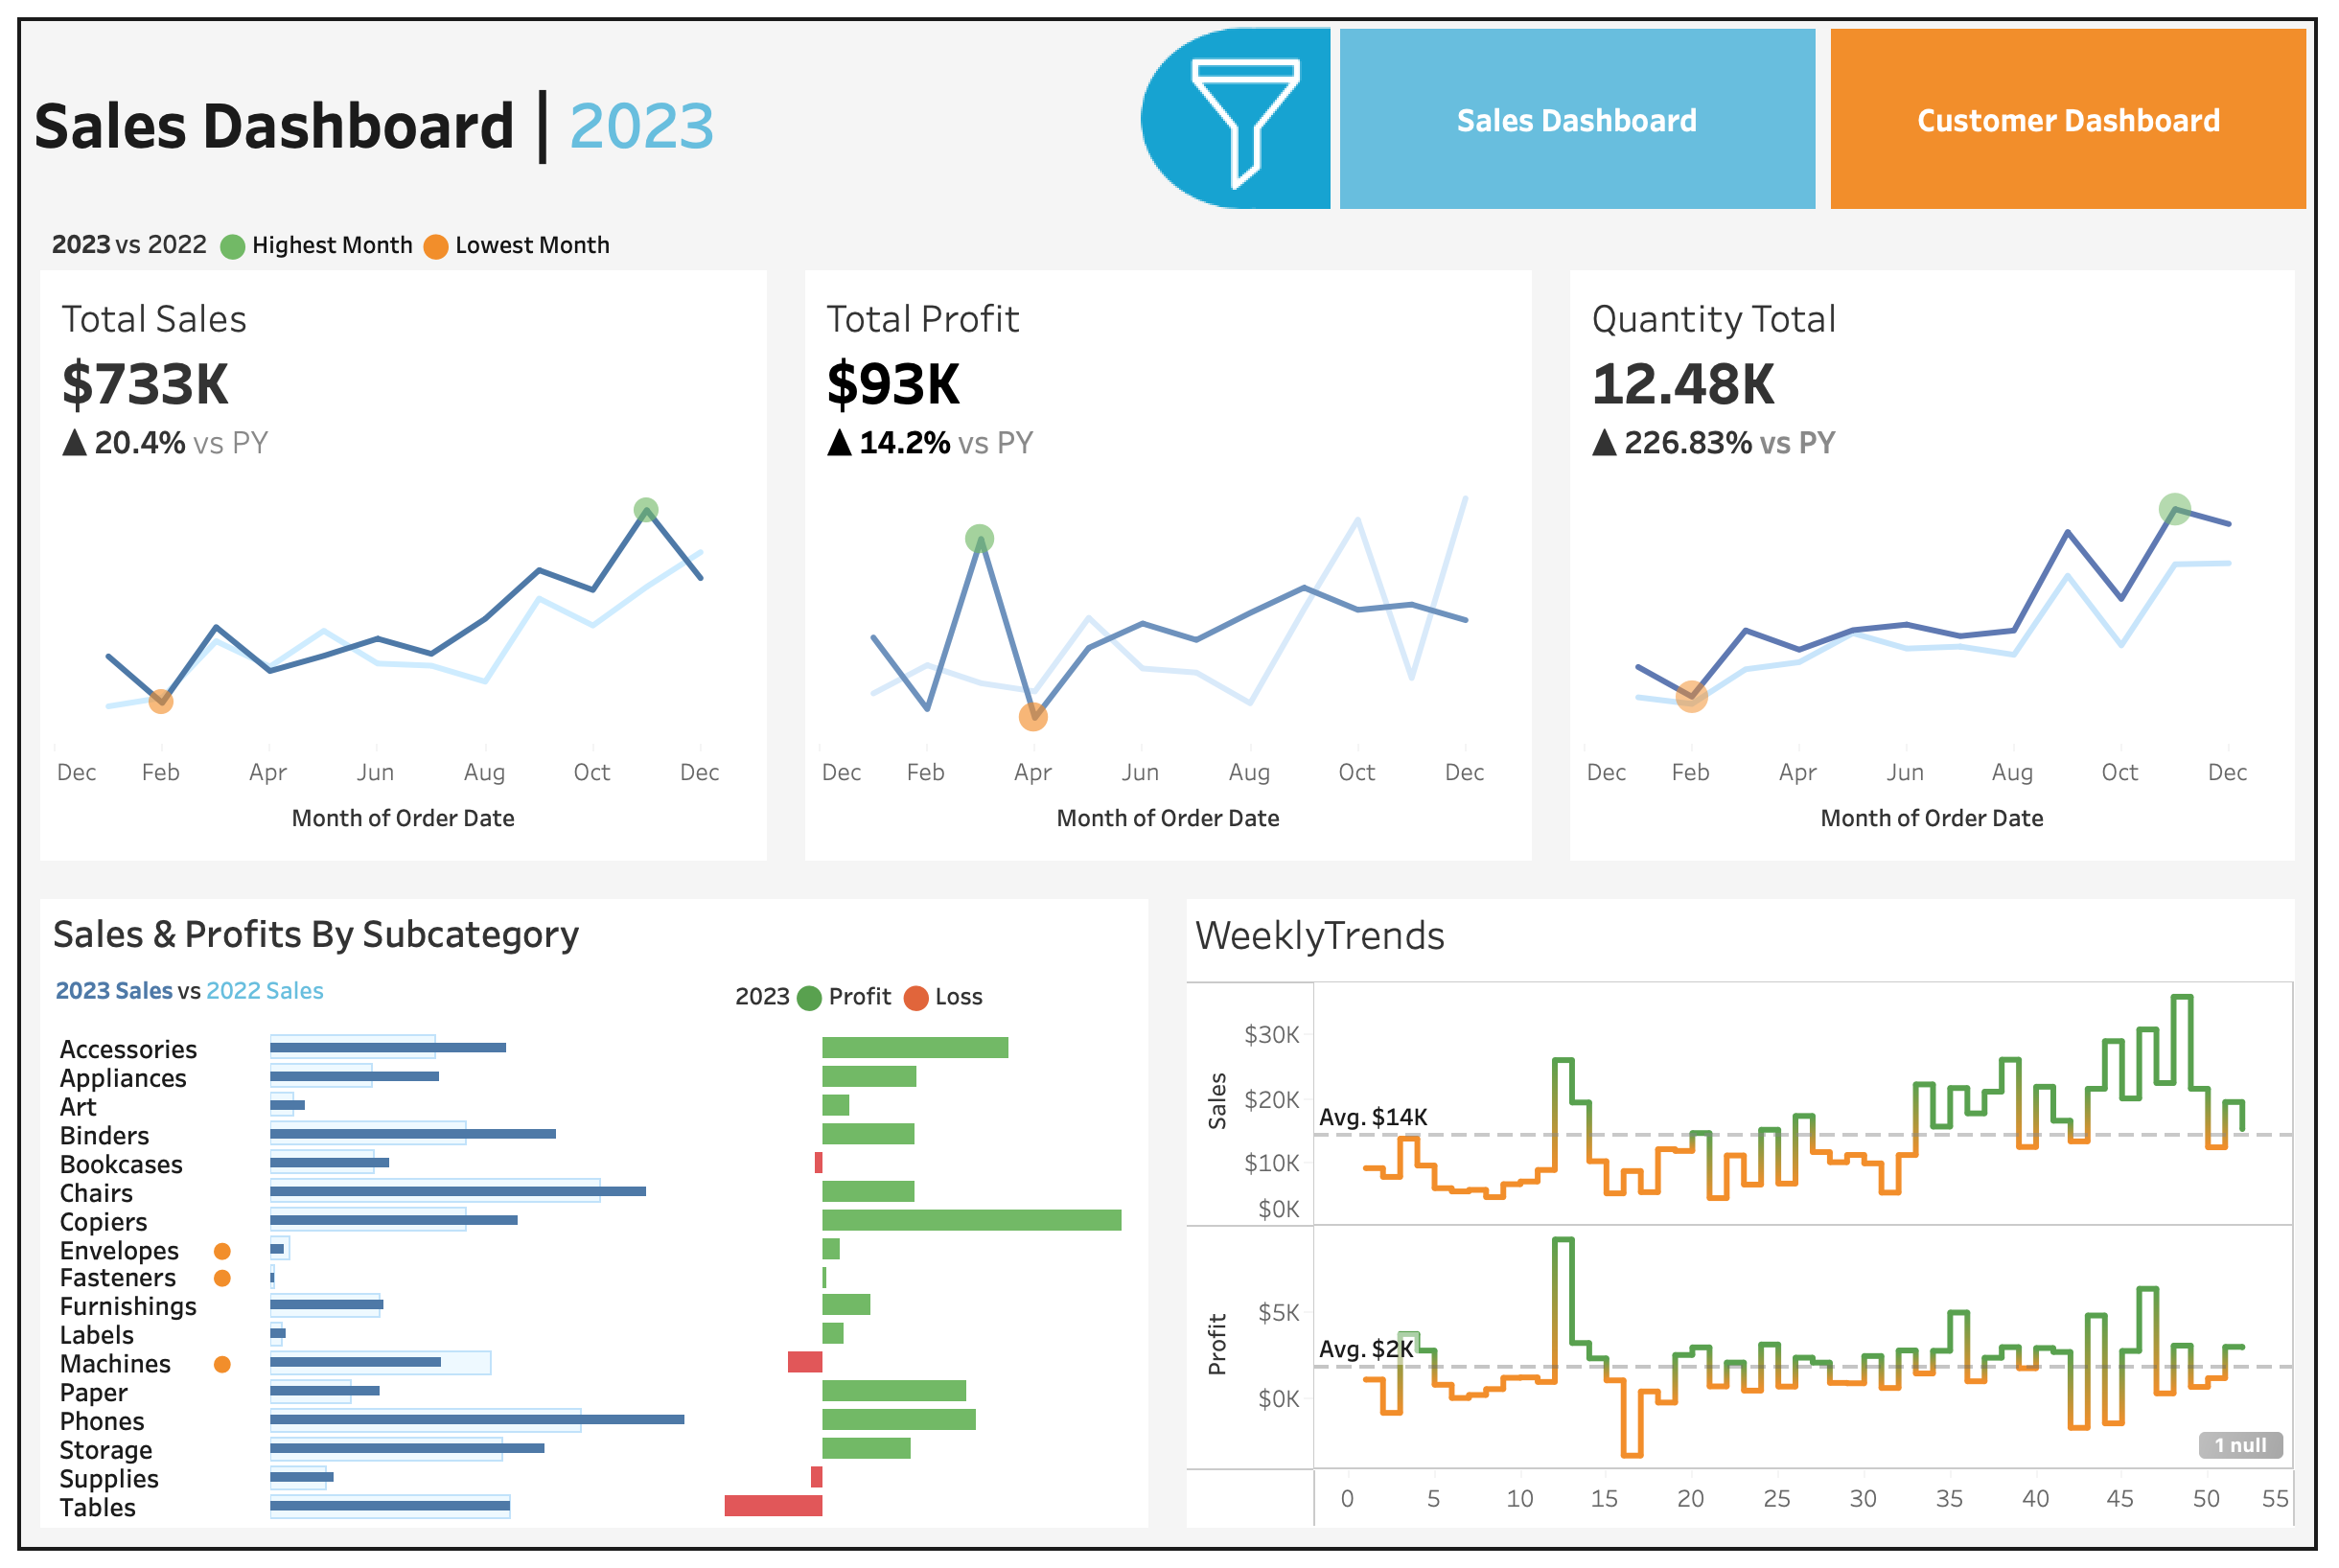
Tableau Business Performance Dashboard
This Tableau-based business intelligence dashboard solution was designed to monitor and analyze Sales Performance and Customer Behavior on a year-over-year basis. It allows business users to explore key metrics performance, trend analysis and customer segmentation through interactive, filterable dashboards for dynamic exploration.
Use Cases:
📈 Sales teams - Reviewing YoY product performance
👥 Marketing - Analyzing high-value and loyal customers
🌎 Regional managers - Filtering performance by state or city
📊 Executives - Exploring KPIs, drill-down and trends at a glance