Business-Performance-Dashboard
Tableau Sales & Customer Dashboard →
📊 Project Overview
This project is a Tableau-based business intelligence dashboard solution designed to monitor and analyze Sales Performance and Customer Behavior on a year-over-year basis. It allows business users to explore key metrics performance, trend analysis and customer segmentation through interactive, filterable dashboards.
While the data is static, the dashboards are designed for dynamic exploration with features like year selection, drill-down charts, and cross-dashboard navigation.
- Data Source: Sales, Orders, Products, and Customers data (.CSV)
- Tools Used: Tableau Desktop, Tableau Public
- Functionality: KPI comparison, monthly & weekly trends, customer segmentation, top customer ranking
- Goal: Provide decision-makers with insights into performance and behavior across time and regions
🚀 Results
[Published on Tableau Public](https://public.tableau.com/app/profile/alejandro.castro8486/viz/CustomerDashboard_17577388851910/SalesDashboard)
The project delivers two fully interactive Tableau dashboards:
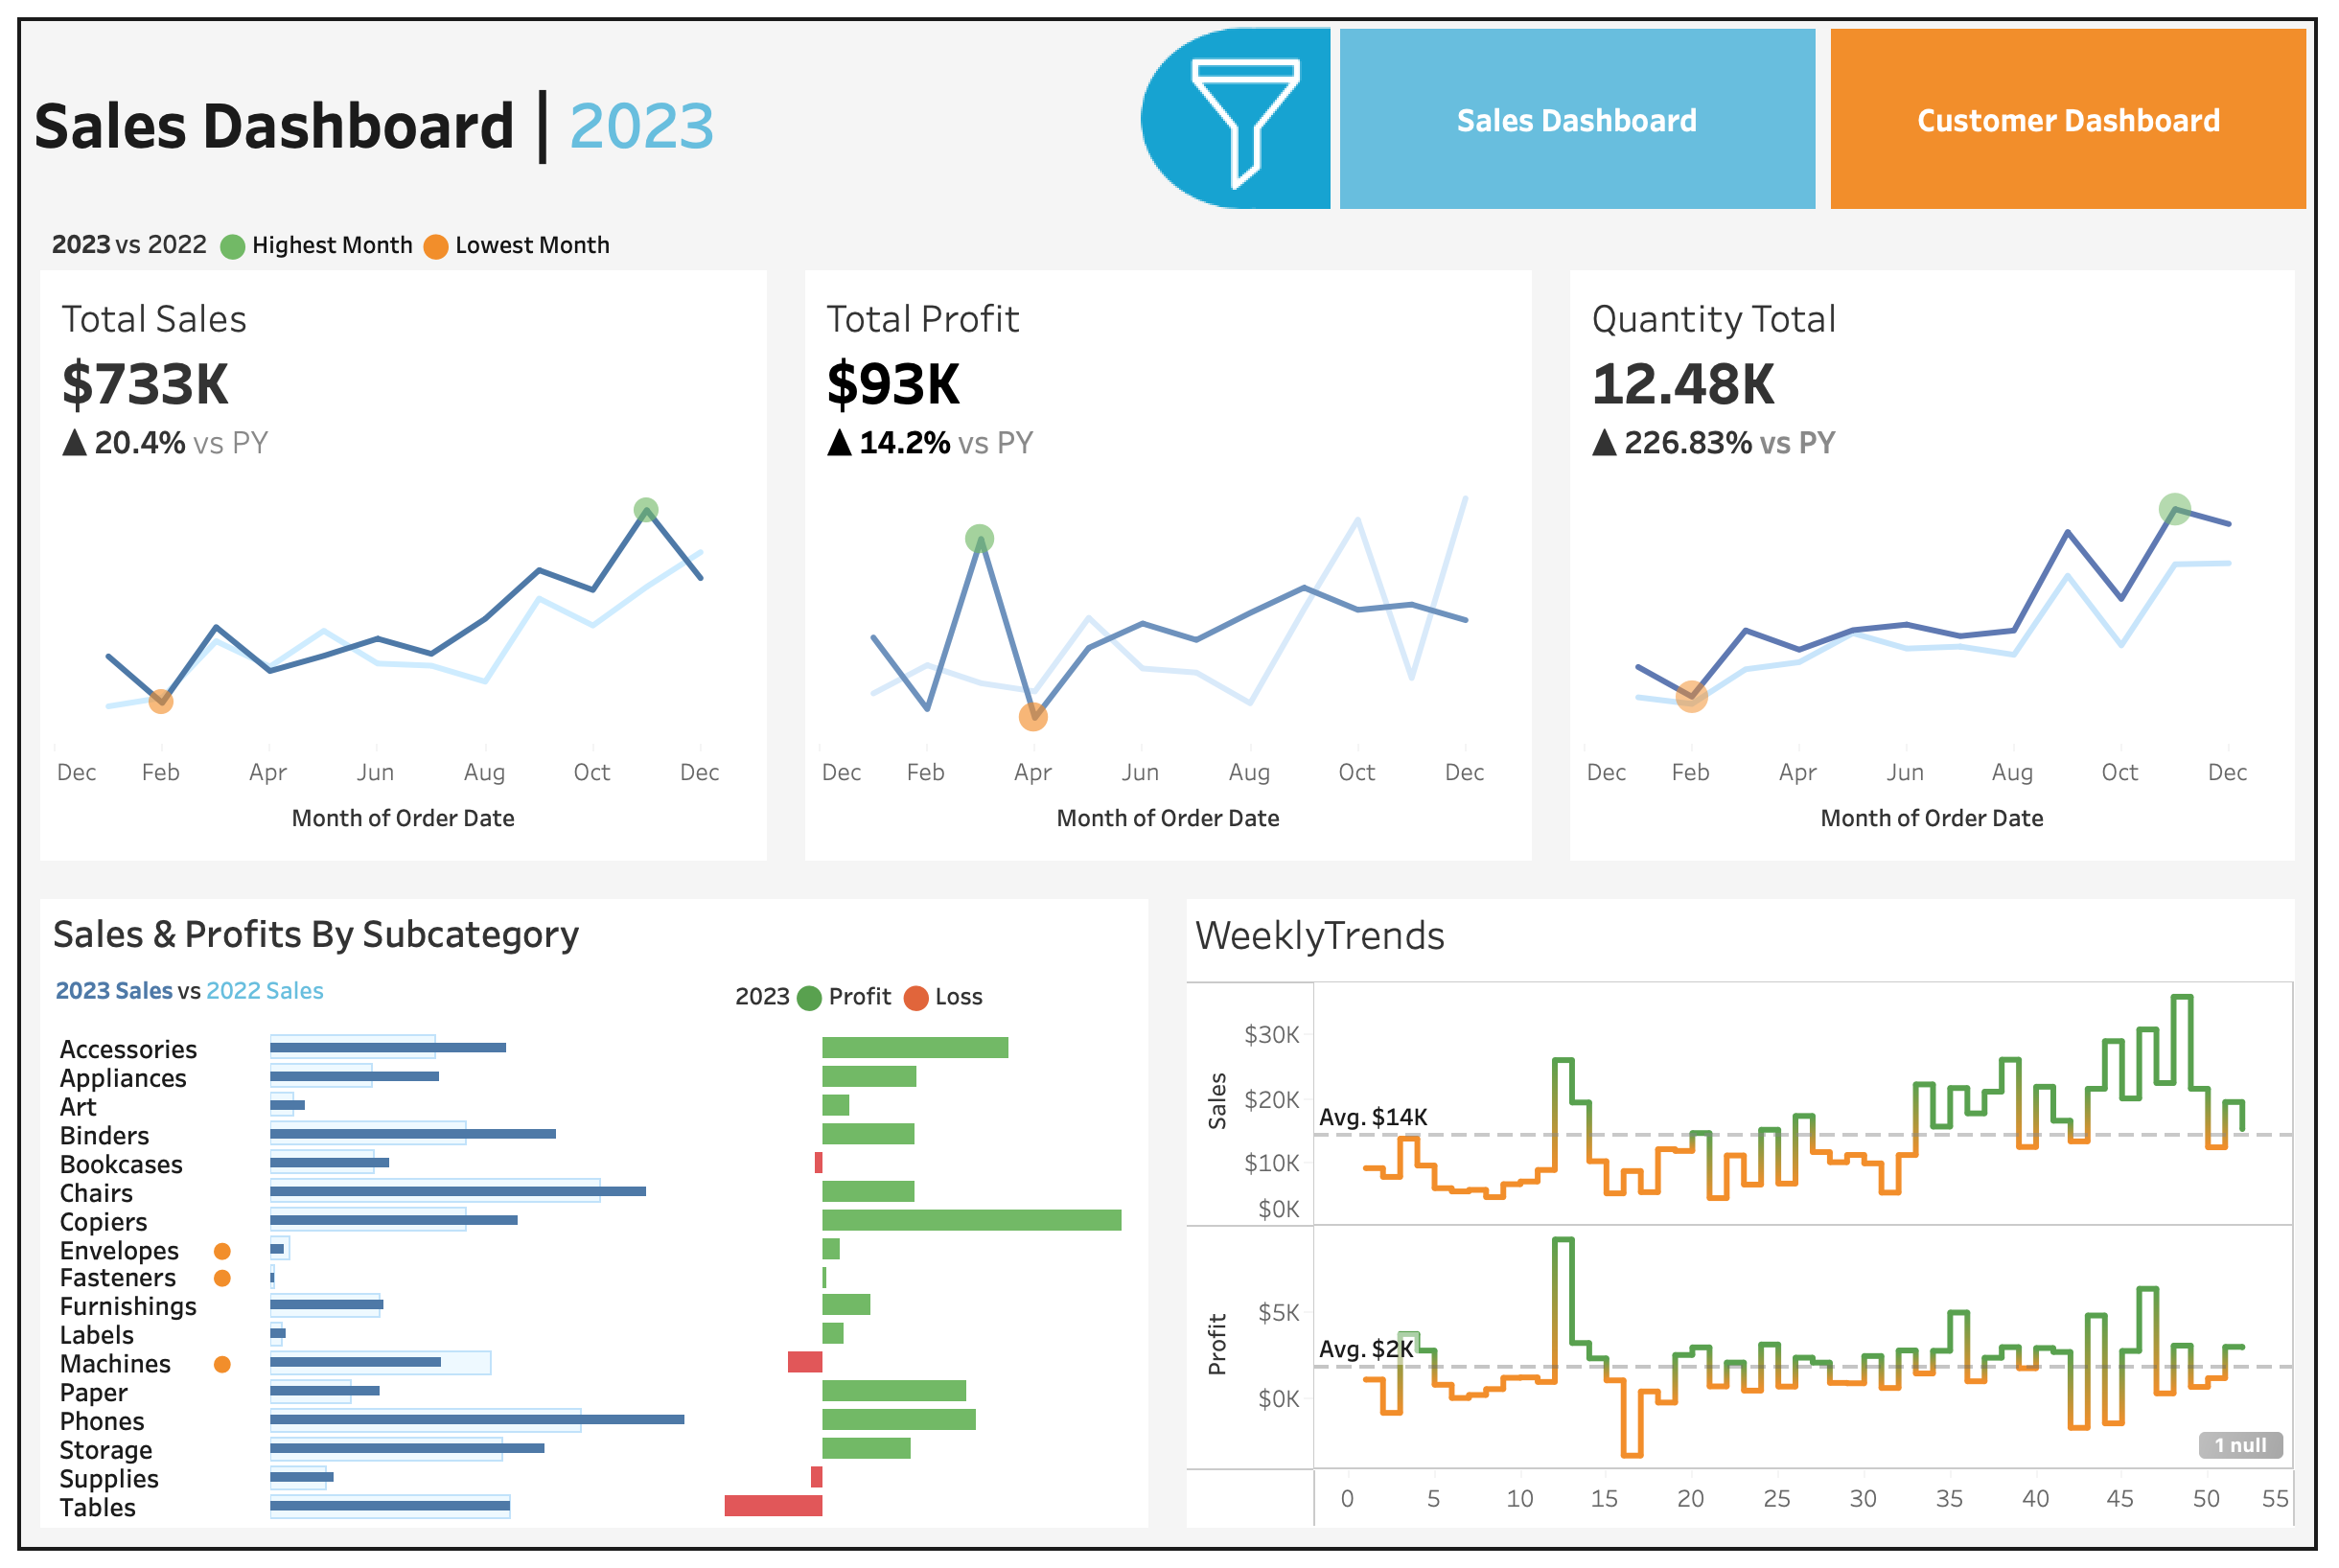
| ### 📈 Sales Dashboard Provides a full view of sales performance across time, product lines, and geography. #### Key Highlights: - **KPI Overview** – Total Sales, Profit, and Quantity (Current Year vs. Previous Year) - **Trends** – MoM breakdown of KPIs with YoY comparison - **Product Subcategory Comparison** – Analyze Sales and Profit across subcategories - **Weekly Performance** – Weekly view with average benchmarks and outlier highlights | ### 👥 Customer Dashboard Focused on customer behavior, engagement, and profitability. #### Key Highlights: - **Customer KPIs** – Total Customers, Sales per Customer, and Order Count (YoY comparison) - **Customer Trends** – Monthly trends of customer activity and value - **Order Distribution** – Visual distribution of customers by number of orders - **Top 10 Customers by Profit** – Ranked table with Sales, Profit, Orders, and Last Order Date |
Dashboard Design
- 📅 Dynamic Year Selection – Toggle between any year and compare it with the previous year
- 🎛 Interactive Filters – By Product Category, Subcategory, Region, State, and City
- 🔄 Cross-Dashboard Navigation – Easily switch between Sales and Customer dashboards
- 📊 Interactive Charts – Drilldowns, tooltips, and click-to-filter capabilities
🧩 Workflow Summary
Extract → Transform → Visualize
- Extract: Import raw data (CSV/Excel) into Tableau
- Transform: Use Tableau calculated fields and parameters to clean and model data
- Visualize: Build dynamic dashboards with filters, highlights, and KPI.
🧠 Use Cases
- 📈 Sales teams reviewing YoY product performance
- 👥 Marketing analyzing high-value and loyal customers
- 🌎 Regional managers filtering performance by state or city
- 📊 Executives exploring KPIs and trends at a glance